





QC SPC Chart Free Version

Beschreibung von QC SPC Chart Free Version
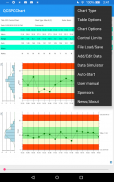
The QC SPC Chart software is an interactive SPC chart (6-sigma) application aimed at quality control professionals (and students) who want to view industry standard statistical quality control charts on their mobile devices. Typical users will monitor critical quality factors in manufacturing, process, and service industries, and display the results in one of the many supported chart types. Chart types include: variable control charts (XBar-R, XBar-Sigma, Individual-Range, and Median-Range), and attribute control charts for monitoring defects (p-, np-, c-, u-, and DPMO charts). The software will automatically calculate SPC control limits using historical data for the supported variable control chart and attribute control chart types. Alarms can be generated for standard +3 sigma control limits, or the WECO (Western Electric) rules. It will also calculate process capability ratios (Cp, Cpk) and process performance indices (Pp, Ppk). A set of specification limits can also be added to the chart.
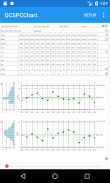
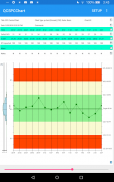
The SPC charts are displayed as one or two synchronized charts, under the control of a scroll bar. The scroll bar can be replaced by an integrated zoom control which allows for the display of charts with a custom time frame. Auto-scaling of the charts y-axes keeps everything in view. An integrated table appears above the chart, that displays information about the process under view, and each sample interval plotted in the chart. The table displays time, individual sample values, sample statistics, process indices, alarm status, and any notes entered for that sample interval.
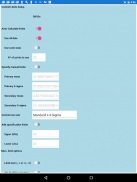
The user can customize the SPC chart and control limits using built-in setup forms. Both auto-calculated and manually set control limits are supported. The user can manually input and edit sample data from within the program. The user can also import sample data from a CSV (comma separated value) file. The entire chart setup, and data, can be saved on the host device so that they are easily accessible the next time you use the app. You can even set the current setup to be auto-loaded the next time the app starts.
The software displays a lot of information on the screen at once, and it is recommended that it be used on devices with a minimum of 1200x800 pixel resolution, landscape or portrait mode.
This app is the free version of the software and the total number of sample intervals (data points) which can be displayed at one time is limited to 100.
Die QC SPC-Diagramm-Software ist eine interaktive SPC-Karte (6-Sigma) Anwendung bei der Qualitätskontrolle Profis richtet (und Studenten), den Industriestandard statistischer Qualitätsregelkarten auf ihren mobilen Geräten anzeigen mögen. Typische Anwender kritische Qualitätsfaktoren in der Fertigung überwachen, Prozess- und Service-Industrie, und in einem der vielen unterstützten Diagrammtypen die Ergebnisse anzuzeigen. Diagrammtypen umfassen: variable Kontrollkarten (XBar-R, XBar-Sigma, Individual-Range, und Median-Range) und Attributsteuerdiagramme zur Überwachung Defekte (p-, NP-, c-, u- und DPMO Diagrammen) . Die Software wird automatisch SPC Kontrollgrenzen unter Verwendung von historischen Daten für die unterstützte variable Steuertabelle berechnen und Steuerdiagrammtypen zuzuordnen. Alarme können für Standard-3-Sigma-Kontrollgrenzen erzeugt werden, oder die WECO (Western Electric) Regeln. Es wird auch Prozessfähigkeitsverhältnisse (Cp, Cpk) und Prozess-Performance-Indizes (Pp, Ppk) berechnen. Ein Satz von Spezifikationsgrenzen kann auch auf den Chart hinzugefügt werden.
Die SPC Diagramme sind als ein oder zwei synchronisierte Diagramme, unter der Steuerung einer Bildlaufleiste angezeigt. Die Bildlaufleiste kann durch eine integrierte Zoom-Steuerung ersetzt werden, die für die Darstellung von Diagrammen mit einem benutzerdefinierten Zeitrahmen ermöglicht. Auto-Skalierung der Diagramme y-Achsen hält alles im Blick. Eine integrierte Tabelle erscheint über das Diagramm, die Informationen über den Prozess unter Ansicht zeigt, und jeder Abtastintervalls geplottet im Diagramm. Die Tabelle zeigt die Zeit, individuelle Probenwerte, Statistiken Probe, Prozessindizes, Alarmstatus und alle für diesen Abtastintervall eingegebenen Noten.
Der Benutzer kann die SPC-Karte und Kontrollgrenzen mit eingebauten Setup-Formularen anpassen. Sowohl die automatische Berechnung und manuell eingestellt Kontrollgrenzen werden unterstützt. Der Benutzer kann manuell eingegeben und bearbeiten Abtastdaten aus dem Programm. Der Benutzer kann auch Beispieldaten aus einer CSV (Comma Separated Value) Datei importieren. Die gesamte Karteneinstellung und Daten können auf dem Host-Gerät gespeichert werden, so dass sie leicht zugänglich das nächste Mal sind Sie die App verwenden. Sie können sogar das aktuelle Setup einstellen das nächste Mal die App startet automatisch geladen werden.
Die Software zeigt eine Vielzahl von Informationen auf dem Bildschirm auf einmal, und es wird empfohlen, dass sie mit einem Minimum von 1200x800 Pixel Auflösung, Landschafts- oder Portraitmodus auf Geräte verwendet werden.
Diese Anwendung ist die freie Version der Software und die Gesamtzahl der Abtastintervalle (Datenpunkte), die auf einmal angezeigt werden kann, ist auf 100 begrenzt.


